Investigation CRT Technology: Using a Magnetic Field
to Measure Pixel Pitch
Anthony Mollica
UBC Physics, April 15, 2010
AnthonyMollicatutor@gmail.com
Outline:
b)
February 11, 2010, Excel Data File
c) Introduction
d) Objectives
e) Theory
f) Apparatus
g) Experiment
h) Experimental Results
i) Bibliography
Introduction:
The goals for this demonstration are to learn about
electromagnetism. In order to do that, an investigation of CRT (Cathode Ray
Tube) technology will be conducted. CRT technology is important because it uses
principles of electromagnetism.
Objectives:
The objectives for this demonstration will be to measure
experimentally something called the vertical pixel displacement. This will be
done through measurements of magnetic field a distance from a magnet and
calculating a theoretical vertical pixel displacement. After that the
theoretical value and the experimental value will be compared and the accuracy
of the experimental technique will be verified.
Theory:
CRT technology creates an image through a combination of
pixels, which produce individual colours making up a full image. Three primary coloured dots make up a pixel.
Pixels can create any colour therefore because they are comprised of each of
the primary colours. Electrons are used to excite the dots and release
individual colours. The electrons are accelerated through an electron gun by a
potential difference of approximately 30,000 Volts. The electrons are deflected
by magnets inside the screen and hit different locations. The electrons hit a
different location at such a fast rate that the full screen appears to have an
image. Distance between dots within a pixel is called the vertical dot pitch,
see figure1.2.
The vertical dot pitch is the horizontal distance between
dots on the screen.
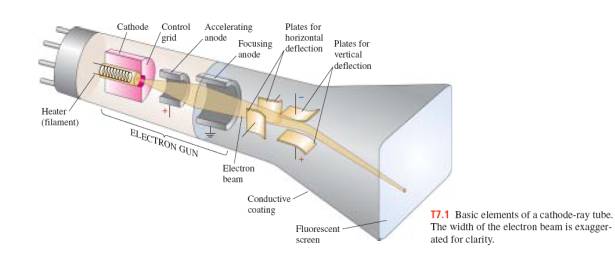
Figure 1.1 – Principles of CRT technology, electrons are accelerated by an electron gun’s cathode and anode and are bent by magnets. The electron then strikes a screen, where light is given off by the electrons kinetic energy.
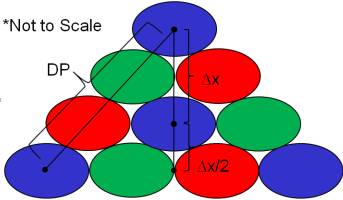
Figure 1.2 –
Vertical Dot pitch distance is the vertical distance between dots of the same
colour.
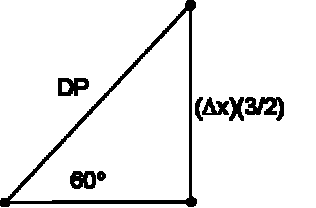
Figure 1.3 – Diagram of the calculation of the vertical dot pitch, using a reference dot pitch value. ∆x is the vertical dot pitch.
Calculation of the theoretical vertical dot pitch is done
through using a reference dot pitch value of 0.20 mm. The theoretical vertical
dot pitch (∆x) is then
used by solving for it in figure 1.3, which is approximately 0.12mm. This is
the value the experimental result will be compared against.
An expression of the amount of deflection from the magnets will be found using physical principles. Magnetic fields at right angles to charged particles or electrons cause a force that deflects the electrons given by:
![]()
The deflection when using the right hand rule is along the vertical axis if the magnet is oriented with its center hole placed as in figure 3.1. Therefore since all the vectors are perpendicular the cross product becomes the product of q, v, and B.
The kinetic energy of accelerating electrons from one side of the screen is given by their velocity using the expression:
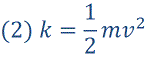
The kinetic energy of the electrons is given by the voltage to accelerate them so it is the product of the voltage V, and the fundamental charge q:
![]()
The velocity of the electrons that are accelerated is thus:
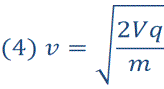
In order to find the deflection of the electrons vertically Newton’s Second Law is required.
![]()
Then using expression one:
![]()
And combining it with the kinematics expression with a constant velocity:

Then subbing for t using velocity of one of the components of the speed is distance over time because there is no acceleration in the x direction.
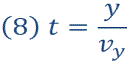
And substituting for the other variables and solving for the vertical displacement ∆x we find:

This is the expression we will use in order to find the
experimental vertical pixel displacement.
Apparatus:
The apparatus consists of a CRT computer screen. There are
no modifications made to the screen, and throughout the whole presentation the
same computer screen was used consistently.
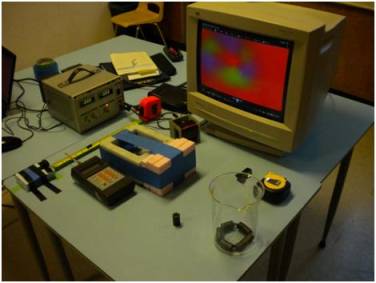
Figure 2.1 – The
CRT screen set up. Large CRT computer screen connected to a laptop, red primary
colour displayed, and colours shown from the distortion of the permanent
magnet. Gauss meter and mounting for the magnets shown.
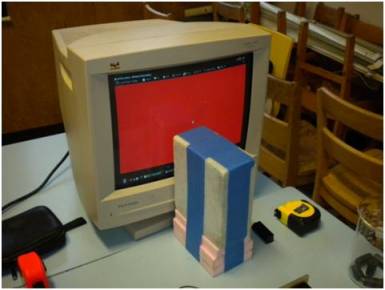
Figure 2.2 – Mounting for the permanent magnet that is put near the screen. Distance of the magnet from the screen is recorded using measuring tape.
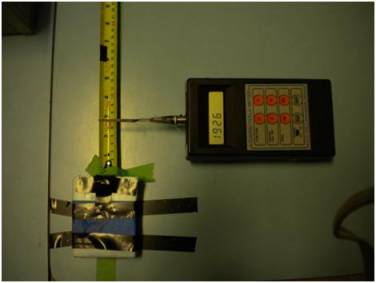
There is a stand that was constructed in order to mount the magnets on when they were moved closer to the CRT screen. Measuring tape was used to find the distance of the mounted magnets on the screen. The magnet mounting was Styrofoam and connected together with electrical tape.
Other apparatuses that were used were a Gauss meter and ruler, taped to the table. A small riser was attached to the back of the Gauss meter in order to keep it level with magnets mounted on another Styrofoam riser.
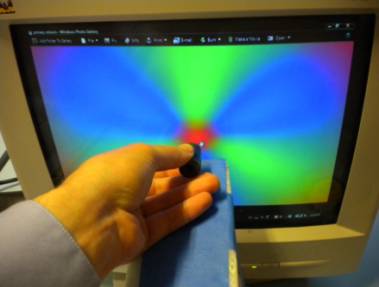
Figure 2.3 –
Distortion of blue primary colour from the permanent magnet. Distance from the
screen ot the magnet will be recorded when the center returns to a blue colour.
This distortion causes the appearance of the other two primary colours: green
and red.
In addition, a laptop was used to connect to the CRT
computer screen and make only one colour appear on the screen using the video
output. The CRT screen was obtained through the UBC Physics and Astronomy
building computer lab. Magnets were obtained through the UBC Outreach lab, and
are commercial ring permanent magnets. The magnetic field strength
approximately 0.8 cm from the magnets was approximately 10 mT. Two permanent
ring magnets were used together to accomplish the magnetic deflection shown in
figure 2.3 and throughout the experiment.
Experiment:
The experiment began by attaching the magnets to the
Styrofoam mounting and moving them closer to the screen. The screen was set to
one primary colour: red, blue or green. The distance between the center of the
screen and the distance from the magnet was recorded. This was the distance
where the screen changed colour from the primary colour, then returned to that
primary colour, at the initial point of appearance. This distance was recorded
twice for each primary colour. After each recording the screen was turned on
and off to degauss the screen or negate any partial magnetism on it.
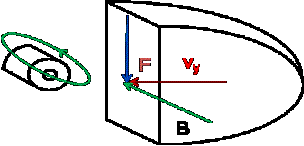
Figure 3.1 –
Diagram of the orientation of the magnet from the screen.
After that the Gauss meter was set to DC mode and magnetic field a distance from the magnet was measured in milliteslas. This was done every 0.2 cm from the magnet from 0.6cm to 5.4 cm. Figure 3.2 shows the orientation of the Gauss meter with respect to the same ring magnets, which were used to deflect the colour on the CRT screen.
After that the date was put into a spreadsheet where the magnetic, field, and displacement distances were recorded. From there the experimental deflection distance was calculated. Expressions for deflection and constants are all shown on the spreadsheet. Data for the experiment on February 11 is shown.
February 11, 2010, Excel Data File
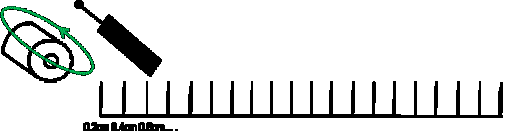
Figure 3.2 –
Orientation of the Gauss meter measuring magnetic field from the magnets. Magnet
mounted so the center of the cylinder of the two magnets is perpendicular to
the ruler.
Experimental Results:
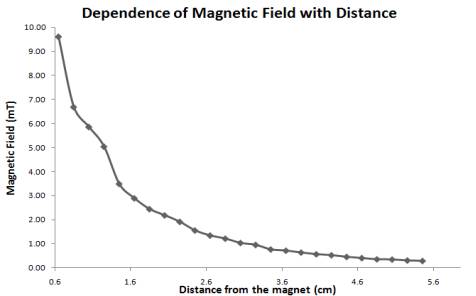
Figure 3.3 - Magnetic field with respect to distance from the two
ring magnets.
|
Colour |
Magnetic Field
Appearance Distance |
Total Magnetic |
||
|
Measurement 1 |
Measurement 2 |
Average |
||
|
Blue |
0.8 |
0.9 |
0.9 |
0.13316 |
|
Red |
1.2 |
1.0 |
1.1 |
0.11165 |
|
Green |
1.4 |
1.0 |
1.2 |
0.11165 |
Table 3.1 – Summary of distances from the screen a magnet
|
Colour |
Experimental Magnetic
Field |
Average Magnetic
Deflection, |
Theoretical Vertical |
|
Blue |
0.13 |
0.12 |
0.16 |
|
Red |
0.11 |
||
|
Green |
0.11 |
The experiment was conducted and the data corresponded very
closely to the experimental value. From the February 11, data set the
experimental vertical pixel distance was 0.12 mm and the actual value was 0.16
mm. This lab was not necessarily meant to be a quantitative lab. Results within
a factor of 10 were expected, and results with the level of accuracy from the
February 11 data set were much better than expected. Thus a discussion of
electromagnetism and its effects on CRT technology were found.
Bibliography:
•
CRT Diagram
http://www.highdisplay.com/wp-content/uploads/2009/11/crt-computer-monitor-269x300.gif
•
Griffiths Introduction to Electrodynamics Third Edition
•
CERN Teachers Lab: Cathode Ray Tube
•
Topic 7: Cathode Ray Tube
http://wps.aw.com/wps/media/objects/877/898586/topics/topic07.pdf
•
LakeShore Model 410 Gaussmeter User Manual
•
Giancoli Physics Third Edition