|
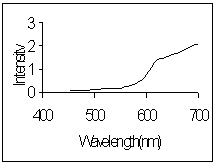
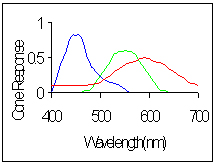
Just as in the first example we can now convolute the
two graphs to obtain the effective signal coming from
each kind of cone. To get the actual signal strength we
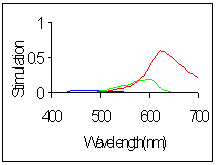
need to integrate the area under each curve in the
resulting graph. For this example we get a signal
strentgh of 5.5 for the rho cones, 3 for the gamma cone
and close to zero for the beta cone.
Our brain performs such an analysis and then bases
its perception of colour on the ratio of these signals.
In this case we would perceive the tomato as mostly red
with a bit of a greenish hue to it. |