The Final Project
Idea:
For the final project, the topic was dedicated to finding out what really matters when dealing with friction. I stayed with the ski wax theme, and now needed a new way to form a snow environment. Enter liquid nitrogen. Liquid nitrogen boils at -195 degrees Celsius, and can make water into ice in under a minute. However, I moved from a quantitative to a more qualitative perspective. Now, I was going to try and see what really matters when dealing with friction, looking at coefficients, the normal force, and surface area.
Construction:
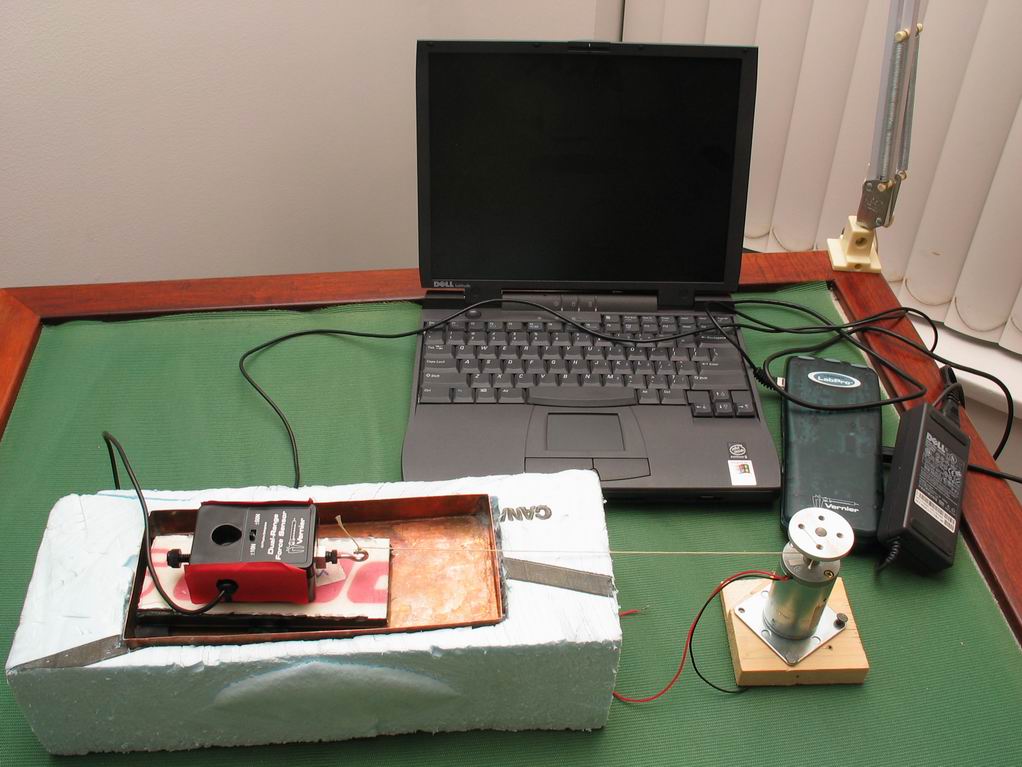
An insulated copper trough was filled with room temperature water. The water was then frozen into ice using liquid nitrogen. Liquid nitrogen boils at -195 degrees Celsius, so one can understand why it was able to freeze the water in under a minute’s time. This method of freezing not only saved time though, as it was also very amusing for students to watch. On top of the newly formed ice, snow was sprinkled. This was done simply by sandpapering large chunks of snow so that they would fall in the size of snowflakes. A motor attached to a string was hooked up to a variable power source. The motor was the driving factor which produced an applied force to the ski. The string was attached to a dual range force censor. Force censors are able to produce force verses time graphs with the appropriate computer program. The program I used was LoggerPro. Overall, the setup looked like this:
Note: The force sensor is the black box on top of the section of ski.
A detailed list of materials needed can be seen here
The final project involved a series of tests done to compare the following Friction Force Vs Time graphs:
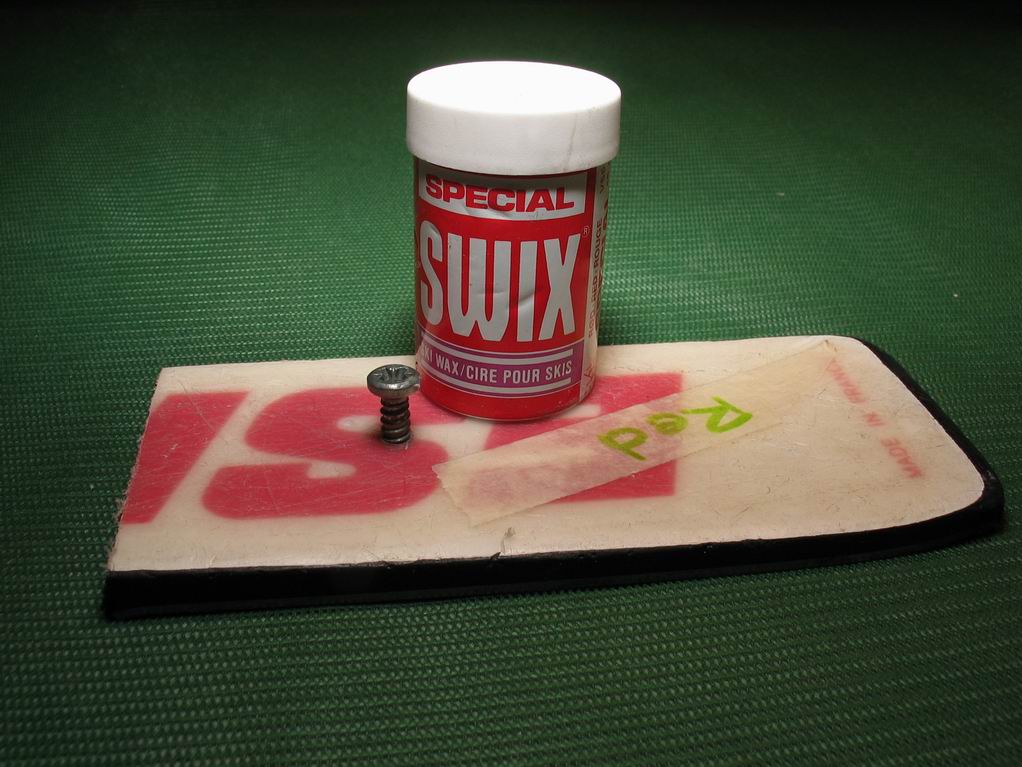
1. Red Ski Wax (soft) on a 15cm ski with an added load graph
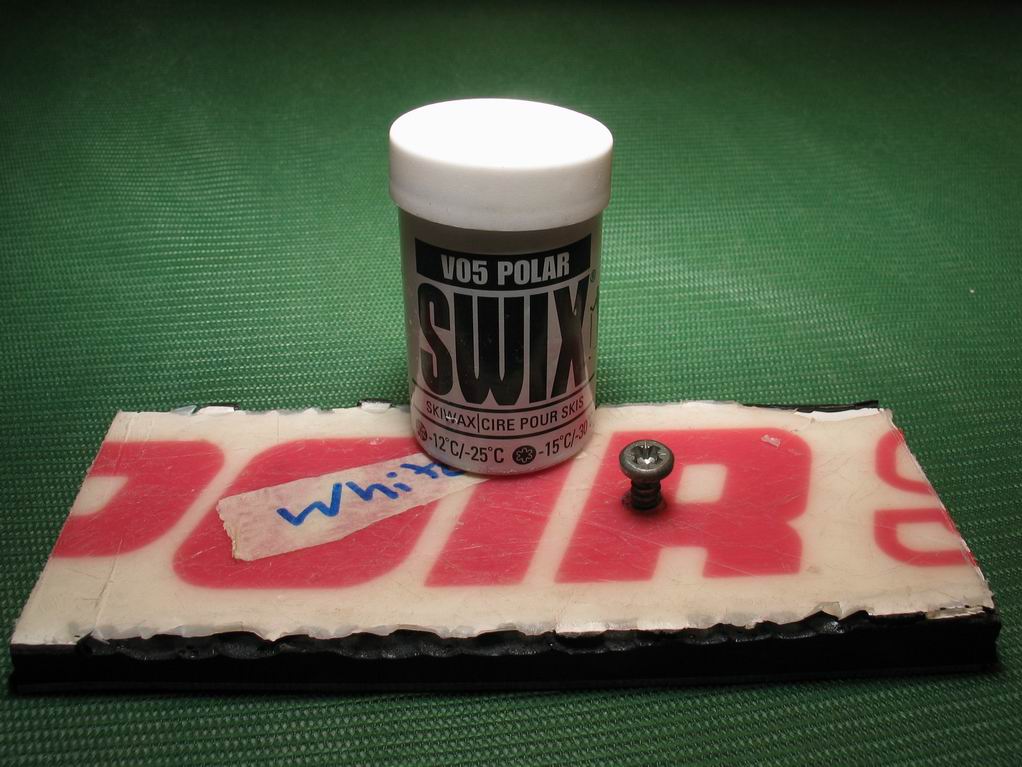
2. White Ski Wax (hard) on a 15cm ski with an added load graph
3. Red Ski Wax on a 7.5cm ski with an added load graph
4. Red Ski Wax on a 15cm ski with no added load graph
Future Considerations
I was unable to find a way to average several graphs into one graph using LoggerPro. This is the type of experiment where having a large sample of trials can give more accurate results. In my case, I just performed the experiment several times for each scenario, and chose a graph I felt was a good representative of all the trials.
As well, having a longer trough with a greater normal force could help get more consistent graphs. By doing this one would hope that as the frictional forces are higher (due to higher normal force) the percentage difference error would go down between trials.