
What is a Pulse?
A pulse has various connotations depending on the context, especially in the sciences. Generally, we take it to mean the speed at which our heart is "beating," during a given time frame. This beating corresponds to the opening and closing of valves in the heart, as blood is being pumped out of the heart. Heart rate is measured in Beats per Minute (BPMs). Average resting heart rate for humans is between 60 - 100 BPMs, with healthier individuals (eg. athletes) displaying around 40 BPMs. Age, diet, genetics and stress are additional factors that affect your heart rate. Knowing and keeping track of your heart rate is thus important as it represents a vital parameter in assessing your health. It's not surprising that students question what physics has to do with measuring your pulse. Well, generally physics is the science of problem solving and as we walk through this problem of measuring our heart rate, we will realize how little knowledge of biology is really needed.
During the presentation we went over the two different ways pulse may be measured: manually and using a sensor. The former method is simply holding your fingers over a measurement point (eg. against the wrist, the aorta by the neck), and counting the 'pulses' caused by the pressure of the blood being pumped in these high traffic areas of the circulatory system. Usually, one counts the pulses in a 6 second period and multiply it by 10 to calculate the average BPM. Yay math!
When people think of a heartbeat sensor they think of one of two things; Electrocardiograms (ECG/EKG) as seen in the medical dramas or fitbit watches. The latter is a distant relative of the circuits demonstrated. Photoplethysmography (PPG) is a very large word and is seldom used in the presentation. Like an ECG, a PPG is a type of heartbeat sensor. In contrast, it relies on optics. Unlike an ECG, no invasive electrodes are needed to measure the patient's heart rate (making it alot easier to get approved for a high school presentation). A PPG uses optics to provide quantitative information of an organ. We are literally shining a light on the problem.
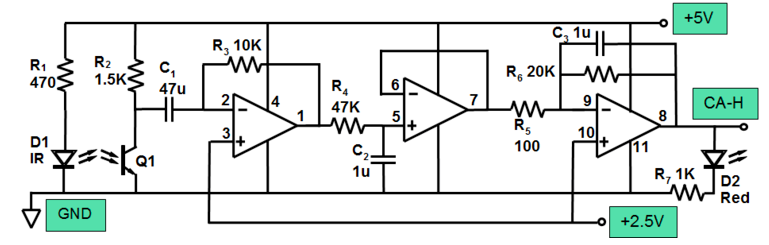
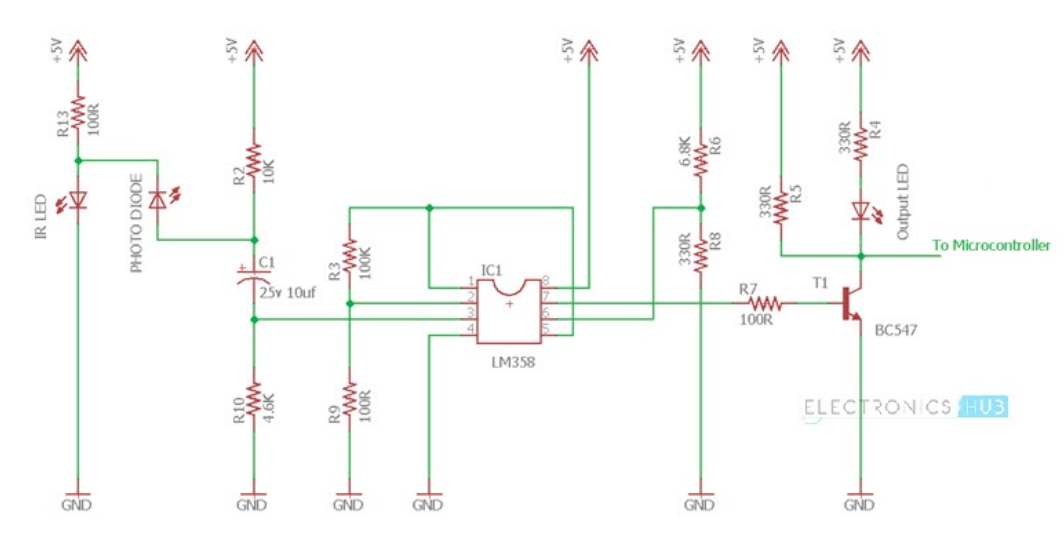
Knowing the fact that Red Blood Cell's (RBCs) reflect/transmit Infrared (IR) Light, we can create a circuit using IR LED and a IR Phototransistor. The Phototransistor picks up this IR radiation emitted by the LED. Note: the phototransistor is sensitive to ambient light (eg. sunshine, room lighting, projectors) The more light that is picked up by the phototransistor, the more current is passed through the circuit (variable resistance). Remember the way we measure heart rates manually is by 'feeling' and counting the beats. These beats are due to a sudden influx of blood being pumped in. Thus, this IR sensor can measure these high and low amounts of voltage corresponding to more and less RBCs present reflecting/transmitting the light.
Furthermore, models 2 and 3 demonstrate that advanced components such as microcontrollers and LCD's or computers tracing PPG curves are not fully necessary. By simply connecting the circuits to power and placing your finger in the sensor strap, one can observe their heart rate simulated by the blinking of the red LED test bulb (BPM is a matter of counting).
At this point, you're probably wondering what the rest of the components and wiring on the board are for? As previously stated, the power and sensor modules are the most necessary and the microcontroller (Arduino) and display (LCD / PC) modules are more 'luxury' components as a LED light can be used to display our output as well. Resistors are used to control the voltage drop across sensitive components. Capacitors and integrated chips (eg. LM 358 OpAmp) are used to filter and amplify the weak voltage signal coming from the IR sensor. The microcontroller is simply a programmable calculator that replaces the friend keeping count. The display module is what we use to output our result. This project has provided me with the opportunity to lecture on pure physics topics such as optics as well as applied physics/engineering through embedded electronics.
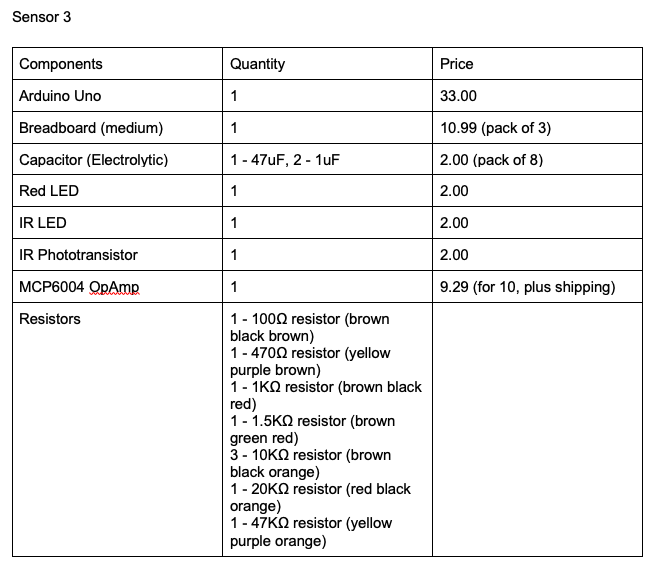
Below is a table listing the necessary materials for the 3 different circuits demonstrated in my presentation. The required quantities of each of the components and their approximate prices are also specified in the table. Most of the components are quite cheap and are sold in large quantities, encouraging you to plan out projects with friends and family. Please note similar components can be found for less depending on source (online/store), delivery time and/or promotion.
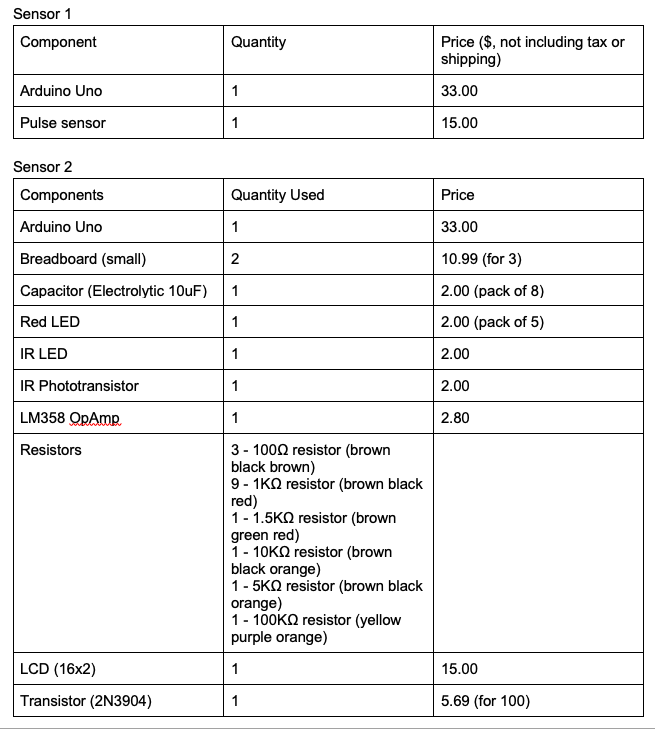
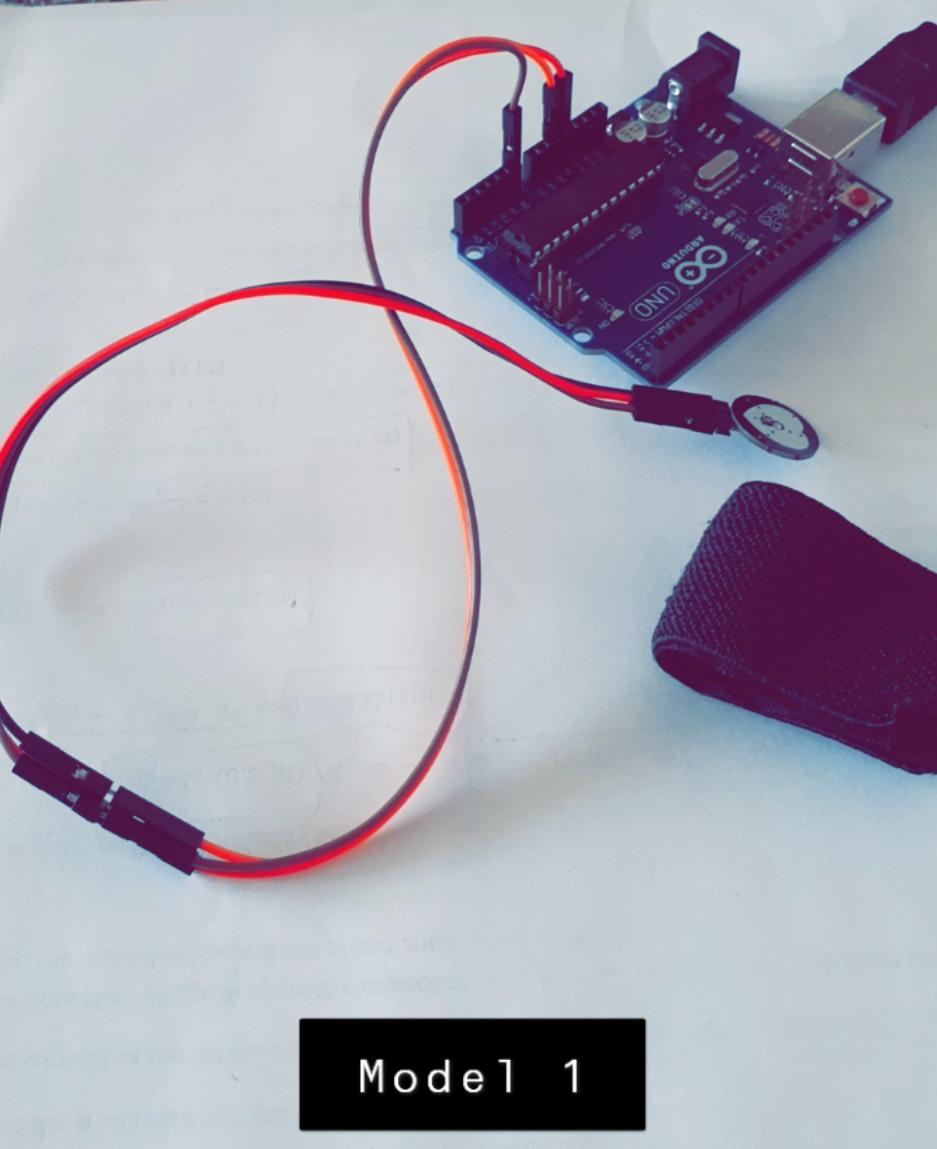
Demo 1 consisted of a "Pulse Sensor Module" and an Arduino Uno. Note this design does not require a breadboard, but one may be added to incorporate other components (eg. a string of lights blinking with your pulse). This was essentially a store bought model intended to be used as a control to compare the other two models with. The pulse sensor module has a corresponding library "Pulse Sensor Playground" of scripts that may be downloaded directly from the Arduino IDE library manager.
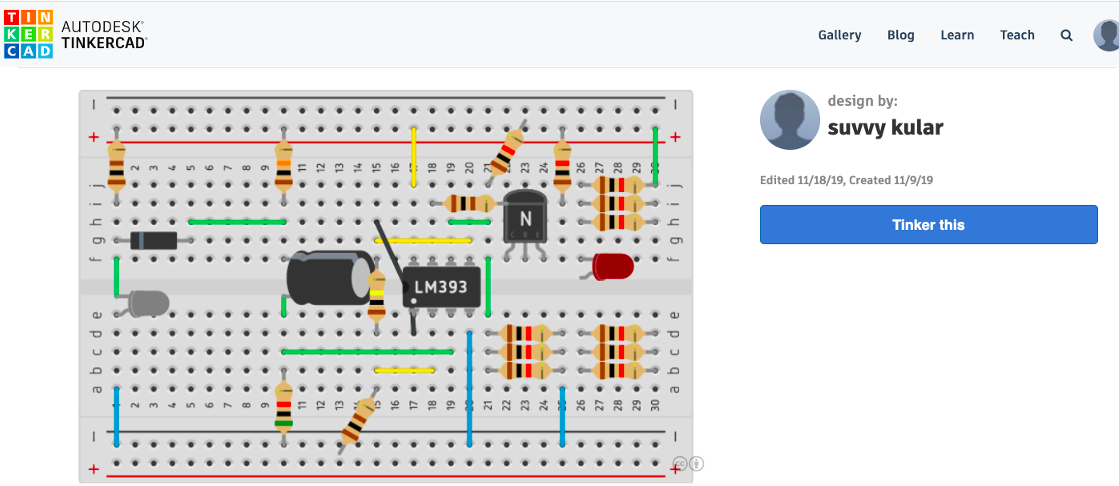
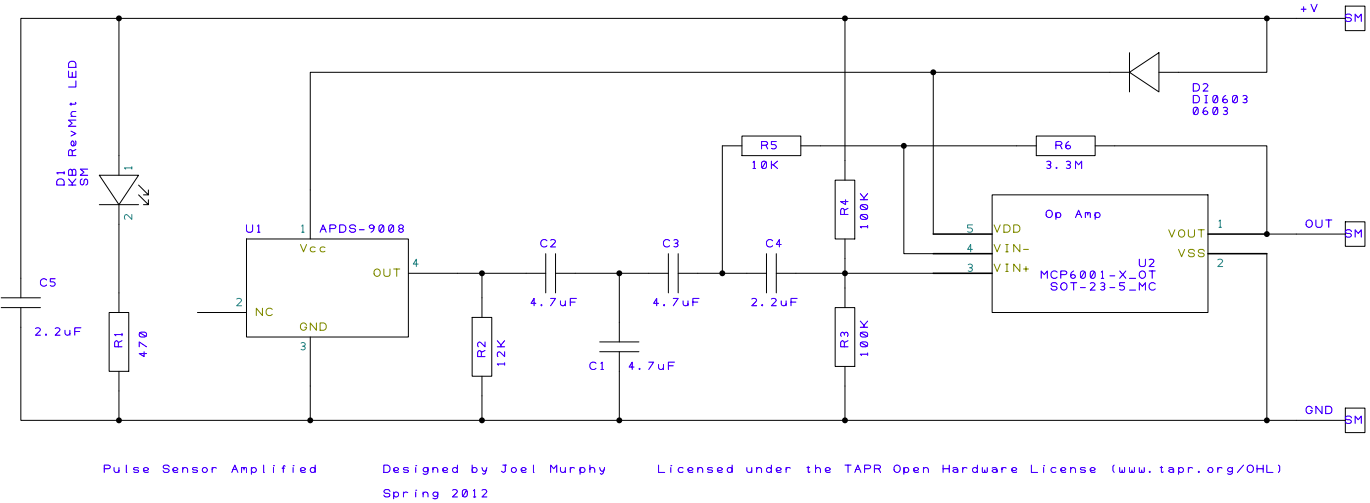
Demo's 2 and 3 are more 'macro' circuits built on breadboards. Breadboards unlike printed circuit boards (PCBs) require little to no soldering (spoiler there was some soldering required later). Components can easily slot into the various pores of the board. Unlike PCB's breadboards can be more fun as well as forgiving as you can easily unbuild and rebuild without soldering. Various peer reviewed articles and schematics from online forums were analyzed (see annotated bibliography) and compared. As you can see in all 3 schematics presented (and many online) the heartbeat sensor can be reduced to a mere combination of capacitors, resistors, an integrated chip and diodes (LED, phototransistor). Software tools such as tinker cad were used to create a virtual breadboard to map out and essentially translate the schematic into a circuit. This also reduces the need to guess when cutting wires to power the board, resulting in less wasted time and materials.
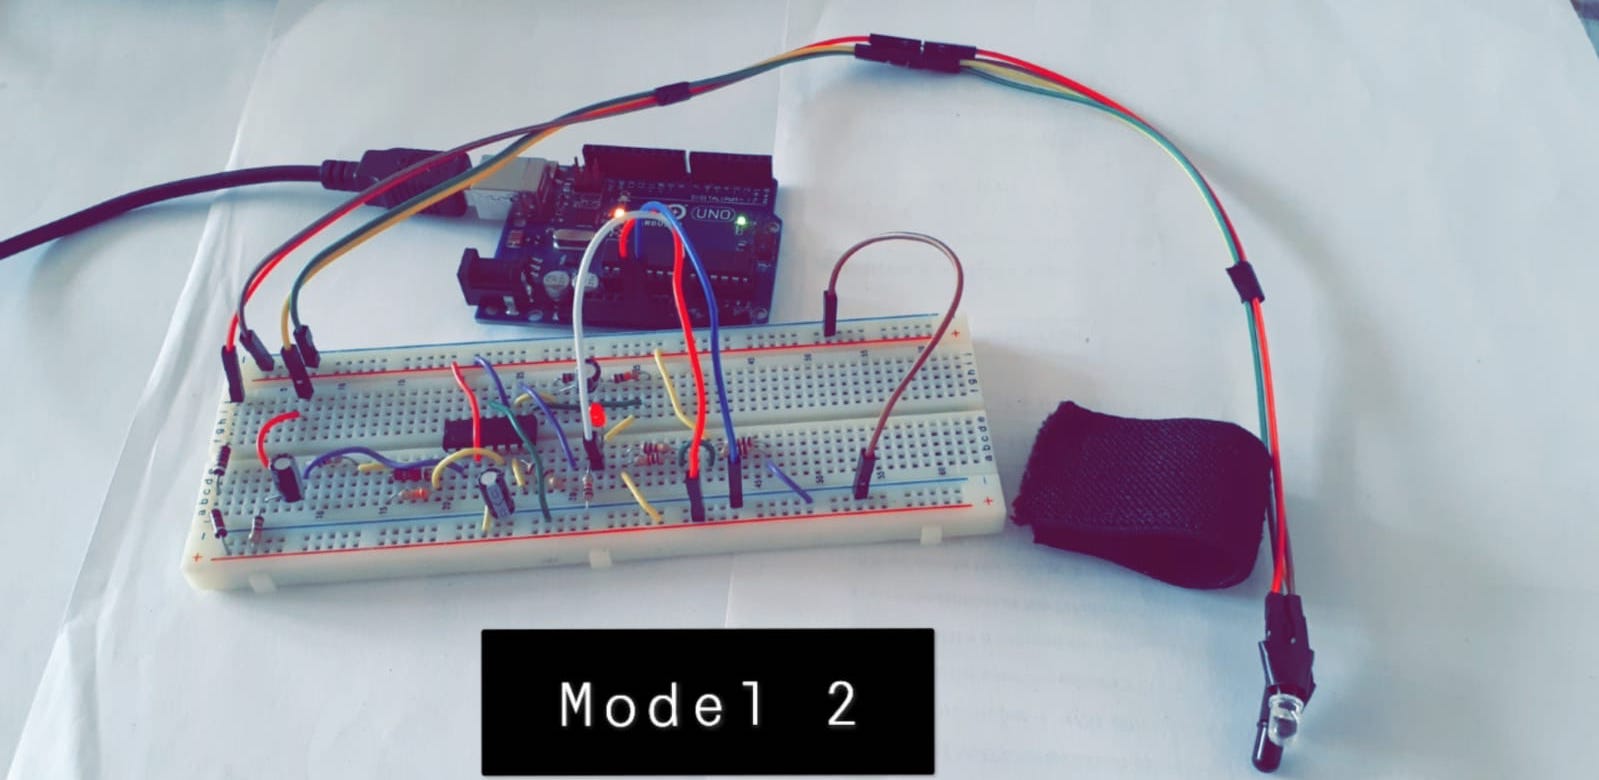
Demo 2 was assembled and disassembled many times. Tinkercad made my work a lot easier, as I tore a circuit apart I would still have a copy to work from later. As you can see in the outdated design below, I originally planned on adding an LCD to this model. However, I only had one LCD that was compatible with the Arduino, limiting this model to the PC like model 1. As seen in the Demo section, both models 2 trace similar graphs and produce similar digital readings as the Pulse Sensor using its same code (with slightly different threshold frequencies).
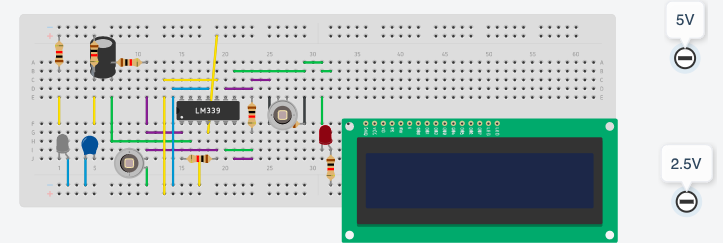
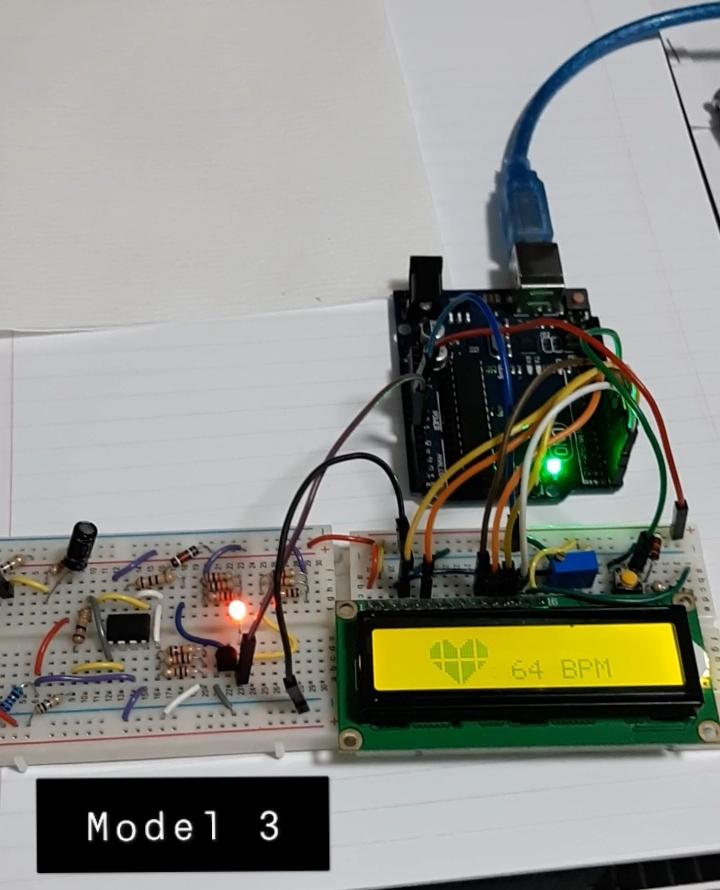
Demo 3 was the original goal of the project, assembling a wireless heartbeat sensor that is able to measure a patient's BPM's. Originally a 9V battery was intended to be used to power this device. However, connecting a USB power bank was a more suitable substitution. For models 1 and 2 the USB connecting to the PC powered the Arduino which delivers power to the board. Model 2 uses a LM 358 Op Amp, while model 3 uses a MCP 6001 14 pin Op Amp. In other words model 3 uses less Amps to filter the signal. This circuit was assembled on 2 half breadboard pieces. One piece was used for LCD screen, its contrast controlling potentiometer (10k resistance) as well as the switch for taking a measurement. The other breadboard piece has the resistors, capacitor, integrated chip as well as IR emitter/detector. Note: due to the unavailability of 330 Ohm resistors, sets of 3 1kOhm resistors were connected in parallel (inspiring an in class activity) to produce an equivalent resistance of 333 Ohms. I designed it this way to show the separate modules (power, sensor, microcontroller and display) and how they connect. Like model 2, this device has a red LED that blinks with your heartbeat, even prior to taking a measurement. The device is now ready to be programmed to do something with this measured data. Note: the Arduino must be connected to a PC to upload a code. This code contains the algorithm for counting the heart rate as well as the string present the instructions (eg. "Please hit start") and the heart shape symbol. Once uploaded to the arduino, the device will remember the code and may be connected to a battery instead of a PC. As previously stated, this presentation presumes no prior coding experience. Various heartbeat sensor algorithms are posted online for free use and development (open source) and may (or may not) work with models 1, 2, and 3. This presentation encourages students to research circuits of their own interest and examine and dissect programs that run them.