We discussed waves briefly when we discovered that sound is essentially caused by vibrations travelling through a medium. But what are waves?
Think about where you have heard of waves before, such as waves in the ocean, or even in a stadium or sports arena! Have you ever watched a hockey or soccer game and seen people do The Wave? A group of people might jump up and sitback down quickly and people next to them do the same.
Consider a speaker. A speaker works through electromagnetic energy transfer to a diaphragm, a thin membrane stretched over the output of the speaker, which vibrates as a result of this energy transfer. If the diaphragm moves to the left, it pushes air molecules on the left together, which in turns creates space for the molecules on the right. The squished particles on the left are compressed and the ones on the right with lots of space are rarefied. When the diaphragm then moves to the right, the opposite happens. Then the lining moves to the left and it is back to the first scenario. These back-and-forth compressions and rarefactions create what is called a sound (pressure) wave.
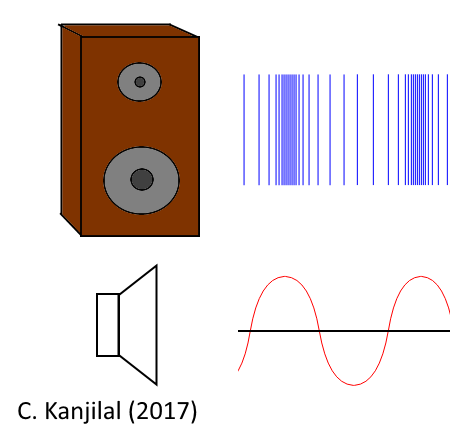
Of course, we cannot ordinarily see sound waves, but we can model what is happening using this knowledge. One way is to create a graph of the position of the lining at various points in time. Take another look at the image above. When there is no sound coming from the speaker, the membrane doesn't move. We could mark this point as the membrane's zero point (i.e. the rest position). As the diaphragm travels left, it's position on the graph becomes negative until it reaches a maximum negative point. Then as the membrane travels back to the right, it passes through the zero point and then continues to another maximum before coming back towards the zero point.
This looks just like a plot of a sinusoidal wave. This plot is known as a displacement plot. We can also describe the force on the molecules plotted against time. In this way, think of the swing set at your nearby park or playground or a pendulum: when you reach your highest point either way you feel the least force and at the zero point (where you started) you feel the most force. A plot of this would also look like a sine graph.
Now that we know what waves look like, we can discuss different types of waves. When a wave is travelling in the same direction as the particles in the medium, these are called longitudinal waves and when the wave moves perpendicular (i.e. normal) to the direction in which the particles are travelling, these are transverse waves. Be sure to check this out: Here is a link to HyperPhysics, where you can find some great explanations on the types of waves.
Now that we can model waves, we also need a way of describing them quantitatively and qualitatively. Let's go back to the movement of the speaker and illustrate what we discussed.
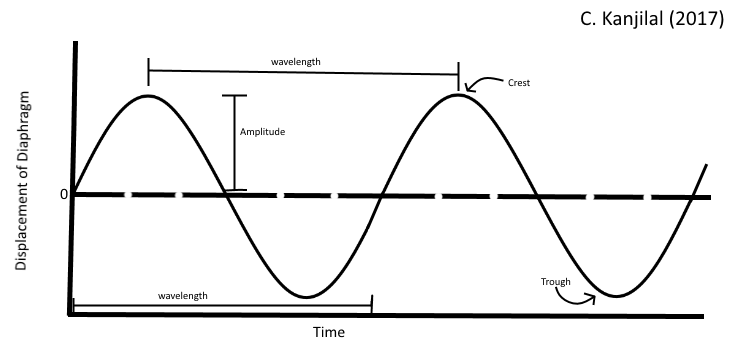
The tops of a wave are called crests and the bottoms are called troughs. The height of the wave from the zero point to its maximum or minimum is called the amplitude. Sometimes, amplitude is measured from crest to trough: this is called the peak-to-peak amplitude. Typically, with sound, amplitude is connected to volumed and perceived as loudness, where a higher amplitude corresponds to louder sounds.
Amplitude is a vertical measurement. Horizontally, we can look at how crests and troughs reappear and repeat. This motion, where things repeat or return at regular intervals, is known as periodic motion. Since a wave repeats like this, we often do not need to look at the whole thing. Instead, we can look at one section, for example from one crest to the next. This is a wavelength. The Greek letter λ (lambda) is used to represent wavelength. A wavelength may also be called a cycle.
Another characteristic of a wave is its frequency. Frequency is a measure of the number of cycles of a waveform that occur in a set time. Frequency is also perceived as pitch. Frequency is measured in cycles per second (c.p.s.) or Hertz. The amount of time it takes for a wave to complete one cycle is known as the period. Period and frequency are inversely linked. Think of it like this: frequency is the number of things per second and period is the number of seconds it takes to do the thing. Mathematically:

Finally, the points on the plot that cross the zero point are known as nodes. The points of maximum amplitude (negative or positive) are called anti-nodes.
An interesting thing to note is that since a rising frequency has a greater number of cycles per second, it follows that each cycle of the waveform becomes shorter in length. Think about this carefully: in a given amount of time, to fit more cycles in the time interval (increasing frequency), the wavelengths have to shorten. This leads to the next section on the speed of sound.
When making a noise and hearing that sound is not an instantaneous process although it might seem like it often. The sound travels from the source to your ears in some amount of time. Compared to our daily lives, sound travels at quite a high speed.
Have you been to a baseball game before? Think back to that time. You may have noticed that when the pitcher tosses the ball, you see the batter hit it but you might have not heard the brack for another split second. Or perhaps you've noticed during a storm that after you see the flash of lightning, the roll of thunder isn't audible for another few seconds.
It turns out that at room temperature and in dry air, the speed of sound is about 345 m/s. The speed of sound is much slower than the speed of light (~3.0 x 10⁸ m/s). This explains why we see the lightning before hearing the thunder. An interesting thing to think about is what happens when something travels faster than the speed of sound? When a vehicle goes faster than the speed of sound, it is said to break to the sound barrier and a sonic boom is produced.
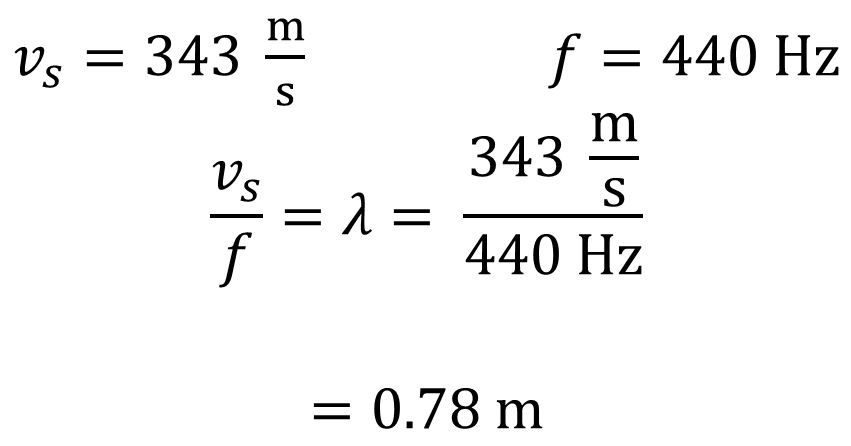
Recall how when frequency increases, the wavelength decreases. This relationship is fundamental to describing the speed of sound. As it turns out the speed of sound is equal to the product of a wave's frequency and wavelength: