Lesson Plan

Documents

Powerpoint

Click here to download the PowerPoint slides for the lesson and demonstration

Student Worksheet

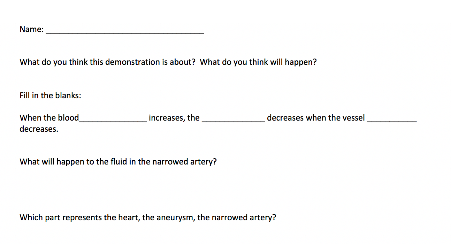
Click here to download the worksheet for students

Evaluation

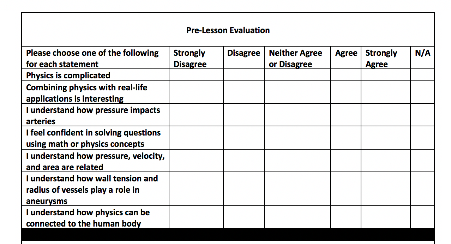
Click here to download the evaluation form for students

LoggerPro

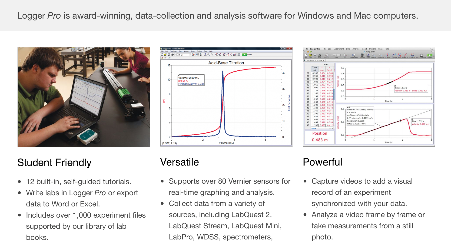
Click here to download the LoggerPro software for presentation

Objectives

  1. Describe what atherosclerosis is (i.e. hardening and narrowing of the arteries) and its effect on the body (i.e. stroke)
  2. Identify an aneurysm in the model and describe it and its effect on the body (i.e. blood-filled balloon-like bulge in the wall of a blood vessel)
  3. Recognize the relationships between pressure and velocity (i.e. Bernoulli’s Principle)
  4. Broader understanding of physics and its applications to real life
  5. Develop a positive attitude toward science

Schedule

The class the day of the demonstrations will follow a schedule similar to this:

  1. Introductions + Pre-Lesson Questionnaire
  2. Short overview of Hemodynamics
    1. Inclusion of student engagement activities such as student-generated test questions
    2. Active learning through collaborative work from questions
    3. Bernoulli’s Principle
    4. Venturi Effect
    5. Continuity Law
  1. Discussion and teacher interaction during and after lesson portion
  2. Demonstration of several hemodynamic topics as discussed in lesson
    1. Use LoggerPro to showcase pressure changes in the body
    2. Discuss diagnosis of patient (see Powerpoint)
  3. Post-lesson questionnaire


Materials

  • Hand-held water pump or a "primer bulb"
  • Clear tubes/pipe of two different radii - more than 10ft
  • 2L of water
  • Red food coloring to mimic blood cells
  • Clear balloon or other durable rubber-stretchy material
  • Two 2L pop bottles as "blood transfusion bags"
  • Milk Jug for all the liquid to go in
  • >10 Hose-Clamps<
  • Two Rubber Bands
  • >10 Coupling or Adapters (connectors) for pipes and to the bottles
  • Three T adapters (1 for the valve, 2 for the sensors)
  • Two or more Pressure meters
  • LoggerPro Instrumentation
  • *Water Shutoff Valve/Switch
  • Silcone to seal pop bottles
* optional

Construction

  1. Ensure you have all materials.
  2. Connect tubing to primer bulb or pump.
  3. Attach thinner tubing via the coupler to larger tubing.
  4. Cut thinner tubing to allow room for a T connector for the sensor.
  5. Again, connect thinner tubing via couple to larger tubing.
  6. Cut Larger tubing to allow room for a T connector for the second sensor and connect both large tubes via the T connector.
  7. Cut the closed end of balloon or condom to attach to the end of the large tubing to create a rubber tunnel – attach using rubber bands (This is sufficient since there is low pressure) to the large tube. For extra security, add hose clamps over top of rubber bands but be careful not to cut the balloon.
  8. Connect the other end of rubber tunnel to the large tube.
  9. Allow large tube to drain into the milk jug.
  10. Congrats! You just completed part one of the construction.
  11. Now, prior to the large tube opening add another tube of the same size to it. This creates the path for the steady flow.
  12. Connect this tubing to the valve (or just connect it to the bottle!) The valve allows you to choose when you want constant flow – this is needed to show Bernoulli’s principle.
  13. Make sure all ends of the tubing are connected to a “blood” reservoir using the 2L bottles or to the milk jug.
  14. The bottles can be connected to the tubing by drilling a hole and adding a coupler to the lid. This way the tube attaches to the lid and the lid attached to the bottle allowing you to add more “blood”.
  15. The pressure sensors are attached to the T adapters, one for the large tube and another for the small tube.
  16. The pressure sensors will then be connected to the logger pro instrument and then to the computer for graphical viewing.
  17. You can shape the tubes however you want – I shaped mine over top a cut out for a human!

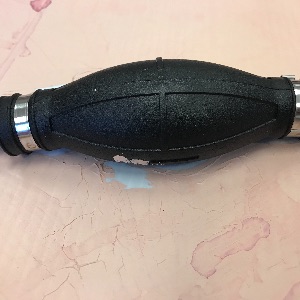
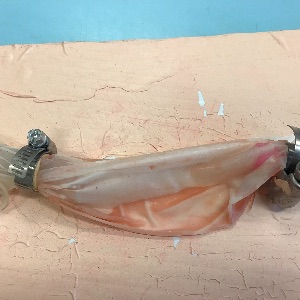
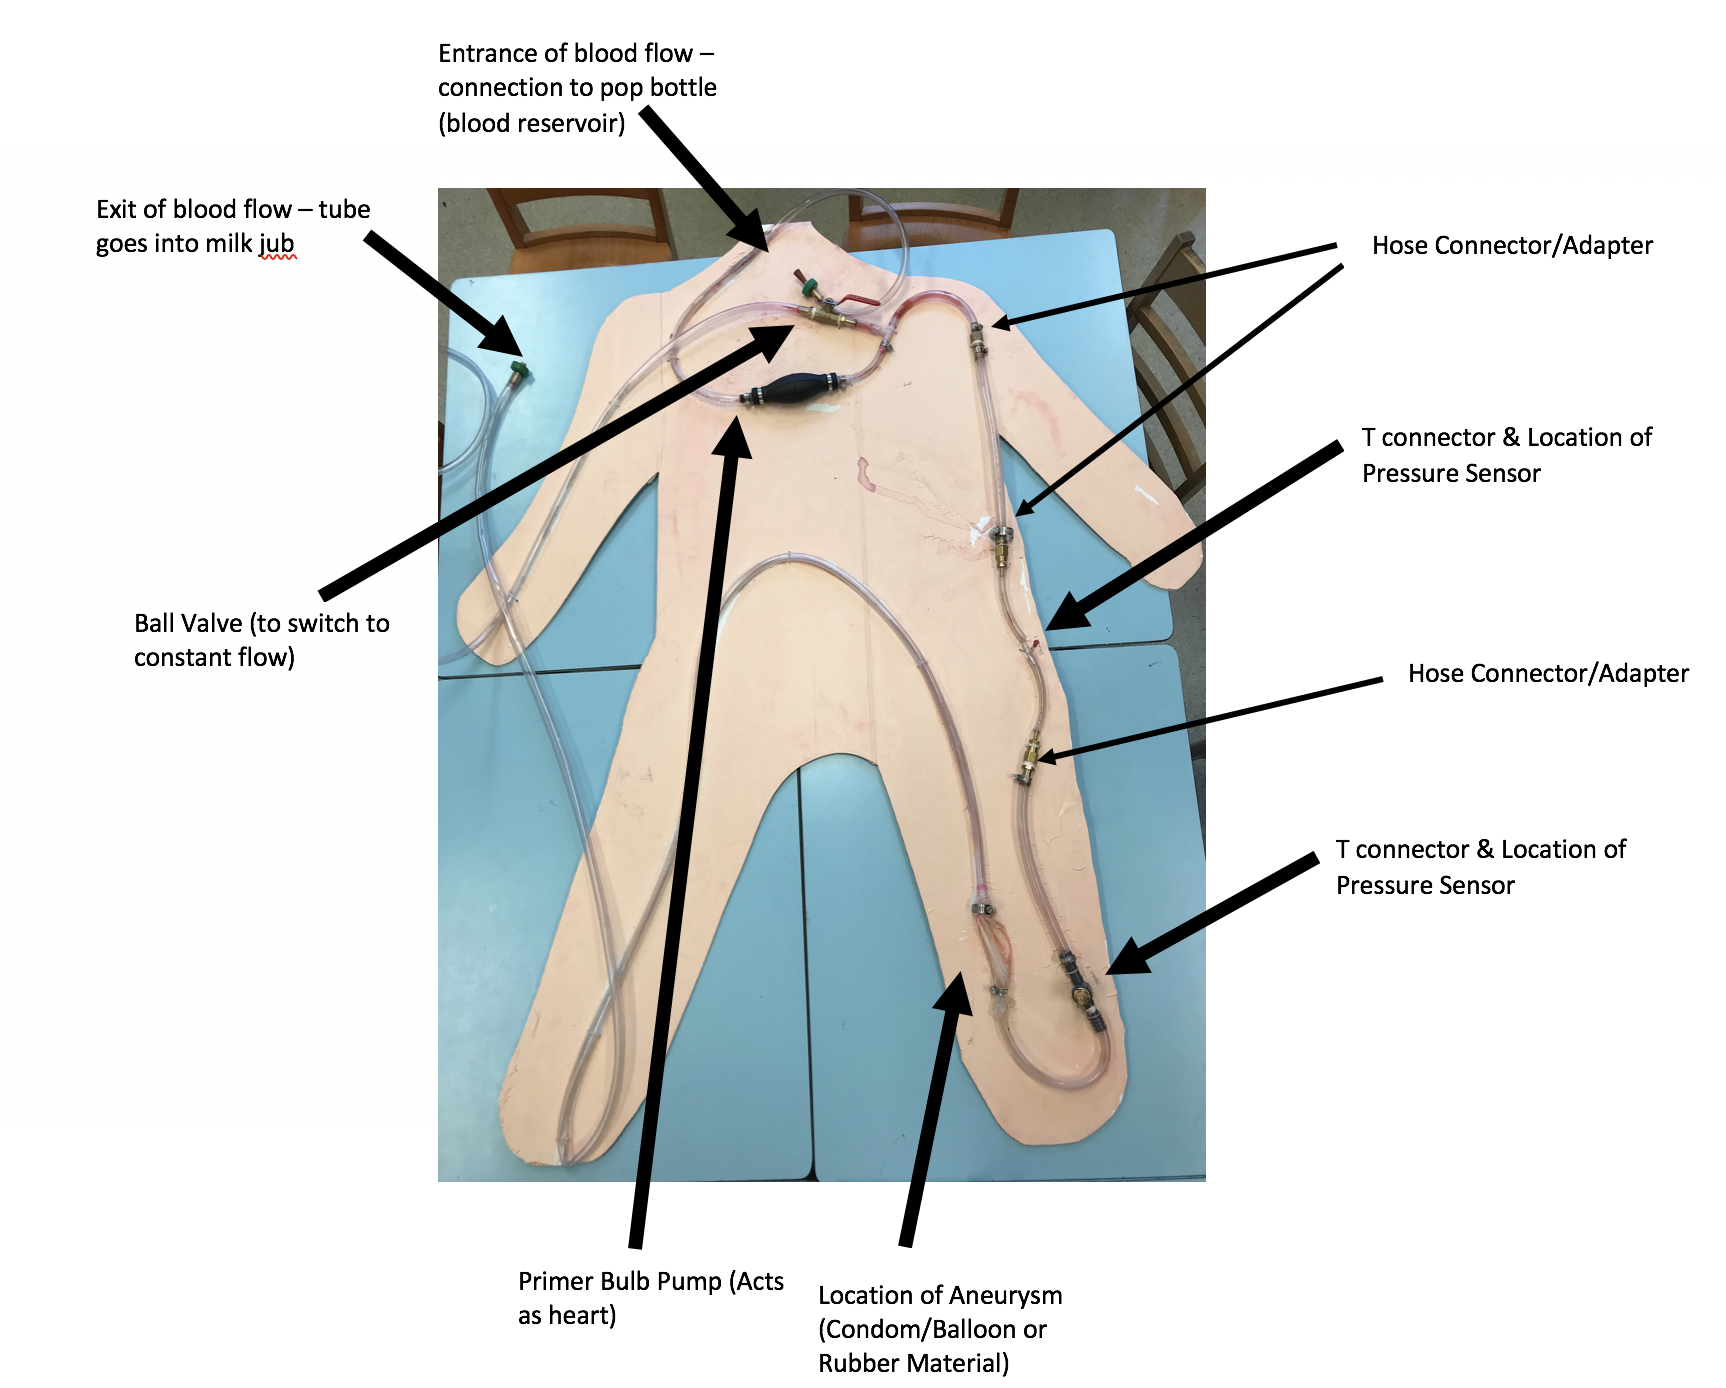
* Ensure the water pump pumps on the down-stroke (to simulate heart contraction) and fills on the up-stroke (to simulate the heart filling)

Set-up Diagram


Implement a fictional scenario for roleplay

Instructor: Let’s pretend I am no longer (insert occupation) and we are at the (insert nearby hospital) and we are in the emergency department. We are a team of nurses and doctors that are ready for a patient that is coming in. His name is (insert patient name). First, thing that happens at the hospital is that they do something called Triage. What kinds of questions should we ask him? (Students respond with questions). Oh no! The patient suddenly has a heart attack! Quick, I need someone to perform CPR and a nurse to help with blood transfusion! (Students volunteer to help with demo). [This is where demonstration happens and where LoggerPro graph can be analyzed]. Great! We saved him! Let’s Diagnose! What do you think is happening to the patient? (Continue with rest of PowerPoint slides and later demonstrate continuous blood flow for Bernoulli’s principle)

Demonstration & Presentation

  1. Ask the students to fill out the pre-lesson evaluation (see above).
  2. Start the presentation with a lesson on circulatory systems connecting to the Bernouilli’s Principle, the Venturi Effect, and Continuity Law (Only talk about its relationship to blood flow and avoid using technological terms).
  3. Throughout the presentation either do group work using whiteboards with students or ask students to work on the worksheet throughout the lesson while connecting it to the demonstration
  4. Example of a question for group work: Using the information from the images below, find the pressure in the aorta where blood has a density of 1060 kg/M3 and the height is 45 cm.

Type of blood vessels

Total cross-section area

Blood velocity in cm/s

Aorta

3–5 cm2

40 cm/s

Capillaries

4500–6000 cm2

0.03 cm/s

Vena cavae inferior and superior

14 cm2

15 cm/s

Table from: https://en.wikipedia.org/wiki/Hemodynamics


  1. Ask the students about what they think will happen when you start pumping in each of the different areas (small pipe vs. large pipe).
  2. Ask what is happening to the elastic area.
  3. Ask what each of the components of the model represents (i.e. the pump represents the heart).
  4. Ask “How does the elasticity of the blood vessel allow it to keep blood flowing continuously when the heart can only contract in pulses?” (Chang & Latourelle, 2003, pg.6).

    The elastic elements of the blood vessel can be stretched via pressures exerted by blood flow (during heart contraction). When this blood flow pressure is released (in between heart contractions) the elastic elements return to their original lengths. This elastic recoil causes a continuous flow of blood between heart contractions where without it there would only be discontinuous spurts of blood flow. (Chang & Latourelle, 2003, pg.6)
  5. Ask students if they have further questions or comments.
  6. Have students complete the post-survey and the additional feedback form.