

Putting all the materials together, I created two demonstrations that showed the Doppler effect. The purpose of the first demonstration was to show students that the Doppler effect does in fact exist. The second demonstration was intended to illustrate how the Doppler effect can be used to determine a range of variables, specifically velocity.
DEMO #1
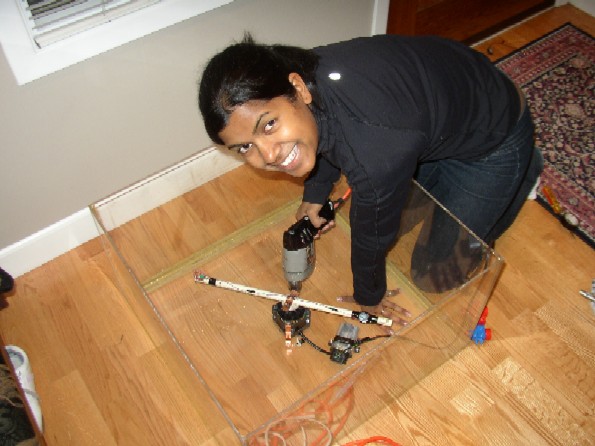
The first demonstration was a qualitative experiment. The tube filled with ten AAA batteries was connected to the buzzer and a switch. This tube was then mounted on a motor and secured with brackets. The motor was fastened to a plexi-glass box in order to stabilize the motor and prevent injuries should the tube fly of the motor!!! The plexi-glass box also had a small hole in the side which was used to hold the microphone.
Before turning on the motor, a reading of the buzzer's original frequency (f ) was taken using the Acoustic Analyzing System's FFT Analyzer. The graph displayed from the stationary buzzer displayed a single distinct frequency as shown below.
When the motor turned on, this peak vanished and was replaced with two peaks side by side. The peak on the left represented the frequency shift that occurred when the buzzer was moving away from the observer (the microphone), and the peak to the right of the original peak represents the frequency shift due to the source moving towards the buzzer.
Hopefully this demonstration convinced everyone that the Doppler shift is in fact a real phenomenon.
DEMO #2
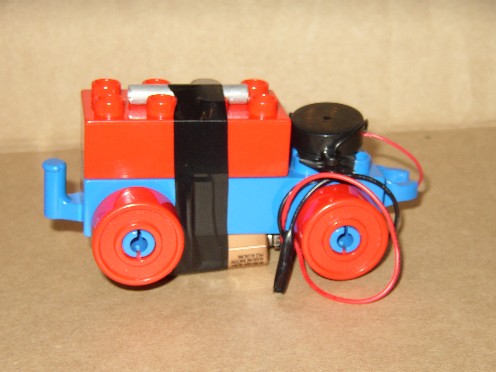
The next demonstration was more quantitative. The buzzer and 9V battery were attached to the Lego car and fishing line was strung through a metal tube also attached to the Lego.
The fishing line was tied to two chairs 10m apart. The microphone was placed at one end of the fishing line and the car at the other. The original frequency of the car was noted. A volunteer swung the car across the fishing line as fast as possible and the peak frequency on the FFT analyzer jumps a bit to the right. This new shifted frequency (f ' ) is estimated from the graph. This data, along with the original frequency (f ) is used to determine the speed at which the car was moving.